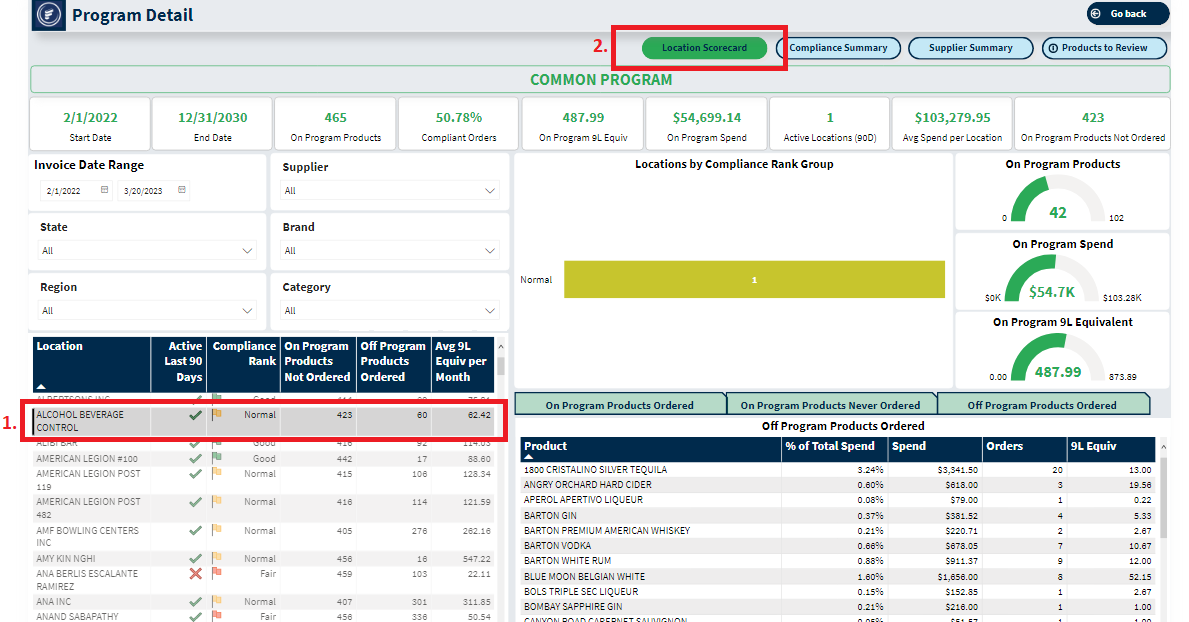
To get to the Program Detail tab, you must be on the Compliance Summary page.
1. Click on the program you would like to see additional information about. In this example "Common Program" has been selected.
2. Once you click on the program, Program Detail will become available to click. Click on Program Detail to be taken to the page.

Once on the Program Detail page, you will see the program name at the top of the screen, and then additional information about the program.
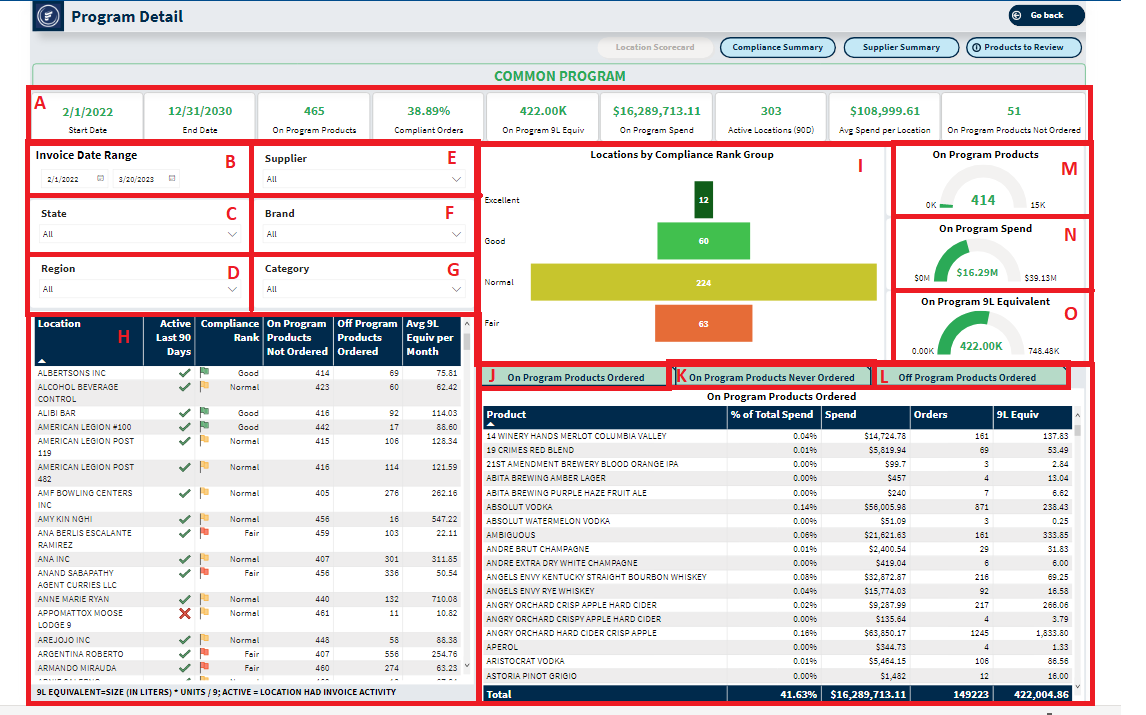
A. Stats about each program. This visual will change as you change filters, such as clicking on different products or locations.
B. Invoice Date Range: The date range shown is the invoice date range that the data is populated from. You can change the date range to see data from a particular time.
C. State: You can choose which state you want to see data from.
D. Region: You can choose which region you want to see data from.
E. Supplier: You can view data from all suppliers, or you can choose a specific supplier to view data from.
F. Brand: You can choose which brand you want to see data from.
G. Category: You can choose which category you want to see data from.
H. Location Chart: This chart shows all program locations.
- You can sort A-Z or Z-A by location by clicking the white arrow.
- After the location name, you can see whether a location has been active in the last 90 days (red x means inactive, green checkmark means active).
- Compliance rank shows how this location compares in compliance to other locations.
- On Program Products Not Ordered shows how many on program products this location did not order.
- Off Program Products Ordered shows how many products this location ordered that are not on program.
- Average 9L Equivalent Per Month shows the average per month of total liter equivalent.
I. Locations by Compliance Rank Group: This chart allows you to filter out locations by how they compare to other locations in compliance. For example, if you click on "Fair", you can see the fair locations filtered out to get more information on just the fair compliance locations.
J. On Program Products Ordered: This chart shows all on program products that have been ordered. If you want to see the on program products for a specific location, click on the location in the Location chart, and the products will show in this chart. You can see the % of total spend, spend, how many orders total, and 9L equivalent.
K. On Program Products Never Ordered: This chart shows the on program products that have not been ordered. This allows you to look at specific locations (click on the location you wish you view data from in the Location chart) to see which on program products the specific location never ordered. If you do not select a specific location, you will see data from all locations until you start to apply filters.
L. Off Program Products Ordered: This chart shows products ordered that do not belong to any program. This is a chart that allows you to see the spend and how much was ordered for each off program product. You can use filters to look at the specific off program products ordered by location/state/brand/category/ etc.
M. On Program Products: This chart shows how many on program products have been ordered.
N. On Program Spend: This chart shows the spend of on program products.
O. On Program 9L Equivalent: This chart shows the on program 9L equivalent.
If you would like to see specific information about a location, click on the location in the Location Chart, and click on Location Scorecard at the top of the page. To learn more, visit the Location Scorecard page here.