Jump to:
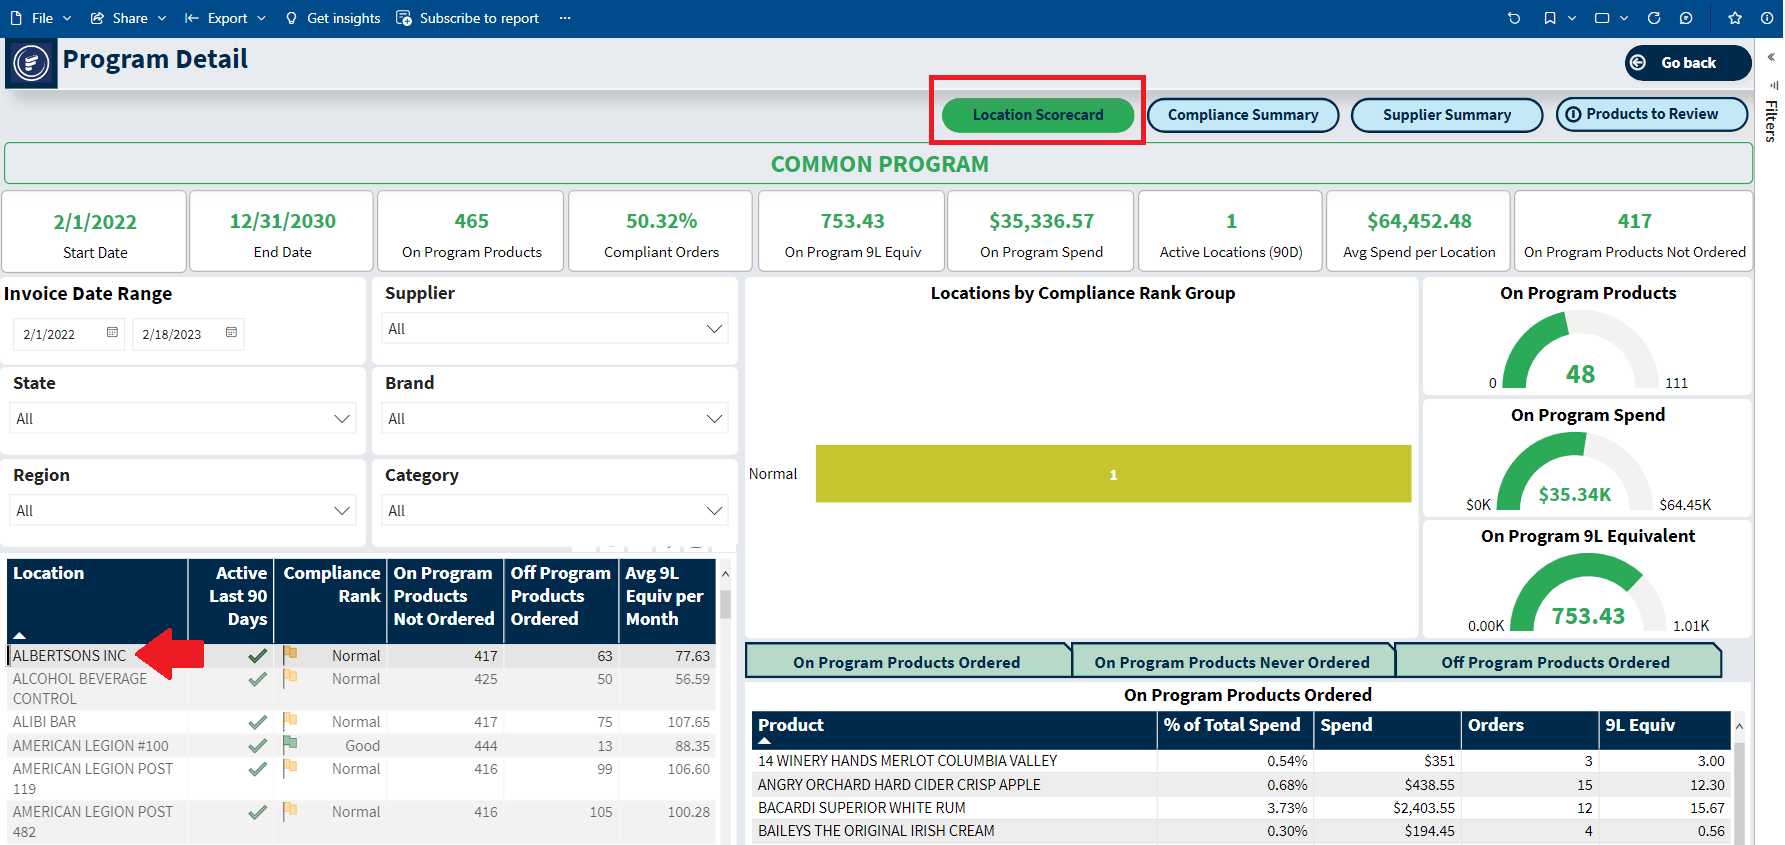
To reach the Location Scorecard for a specific location, from the Compliance Summary dashboard, select a Program and click the green Program Detail button. From the Program Detail screen, you can see a list of locations on this program. Select a location, and the green Location Scorecard button will be active, as shown below:
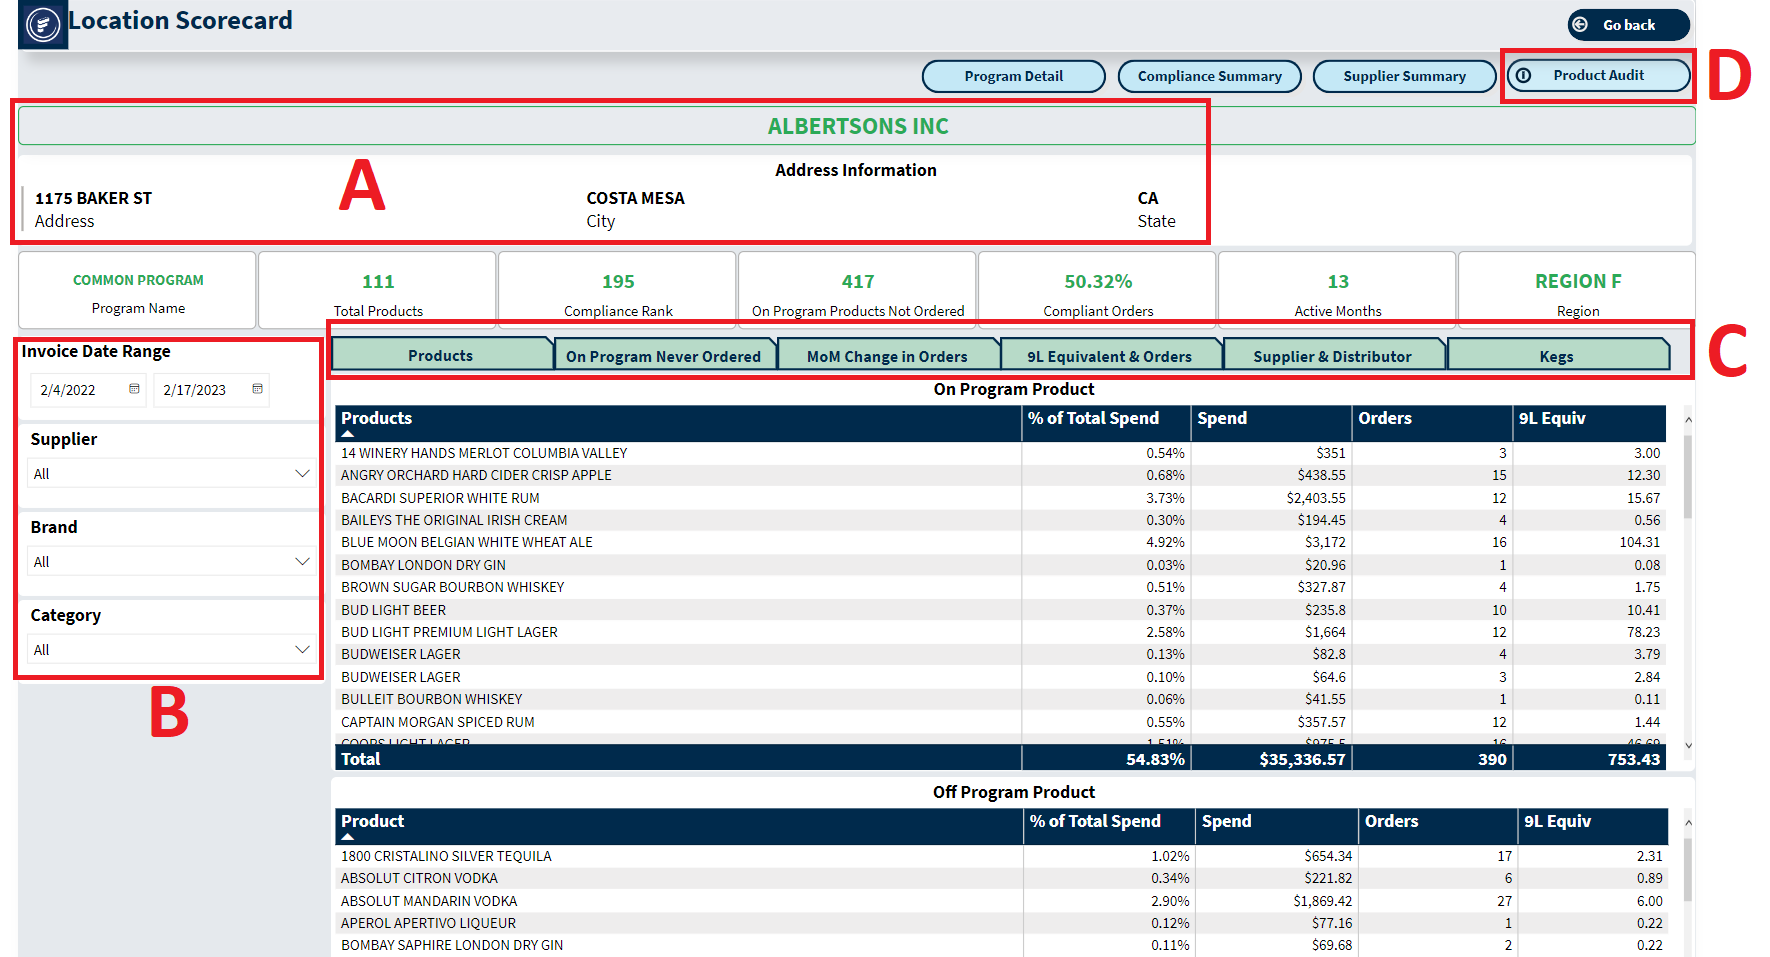
The Location Scorecard dashboard will display:
A. The location name and address
B. Filters for you to narrow down your search
C. Different tabs showing various tables (described below)
D. A button to view the Product Audit page (described below)
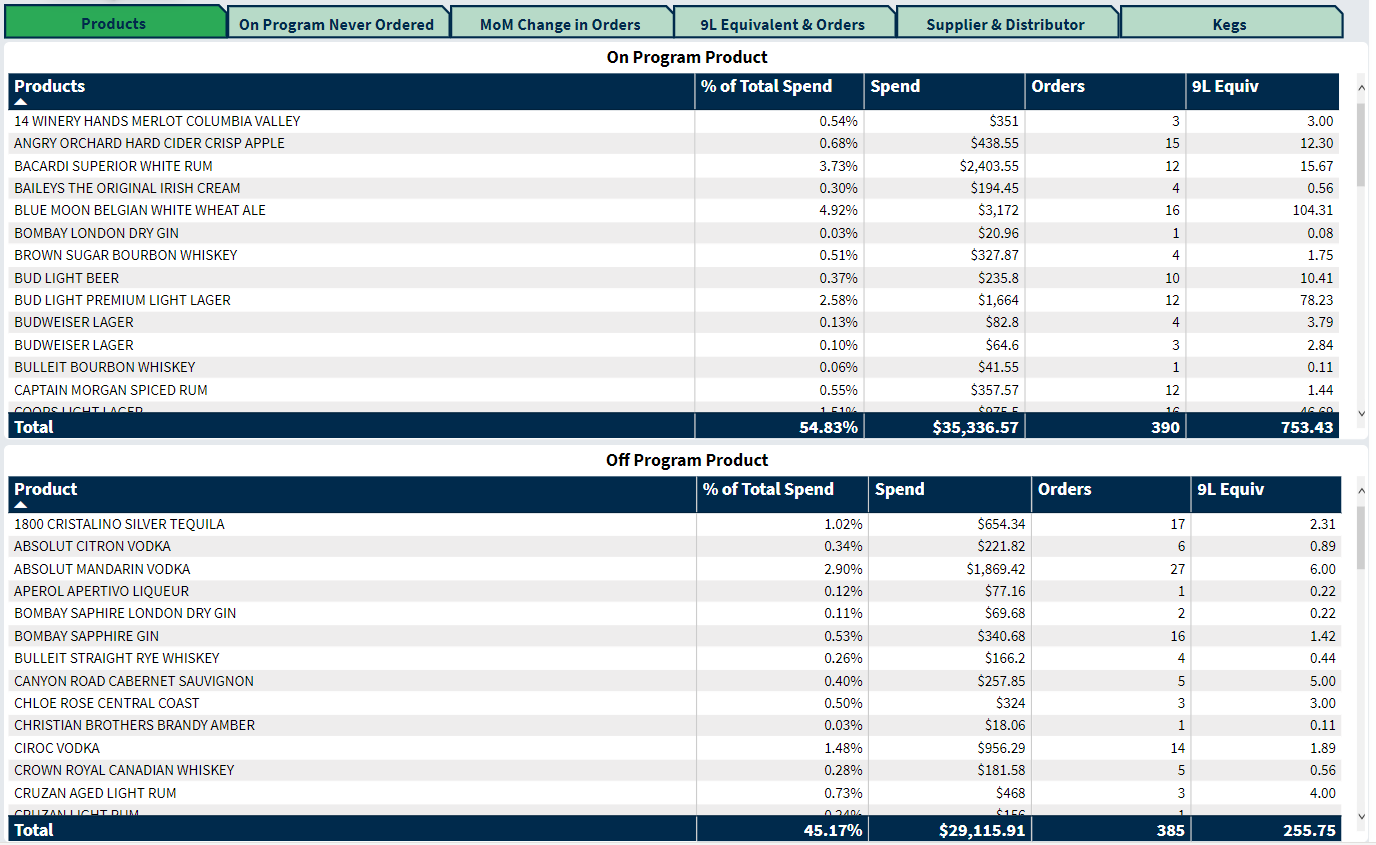
On the Location Scorecard dashboard, the Products tab will display two tables. The top table displays On Program products purchased at this location (based on your filters). The bottom table displays Off Program products purchased at this location (based on your filters).
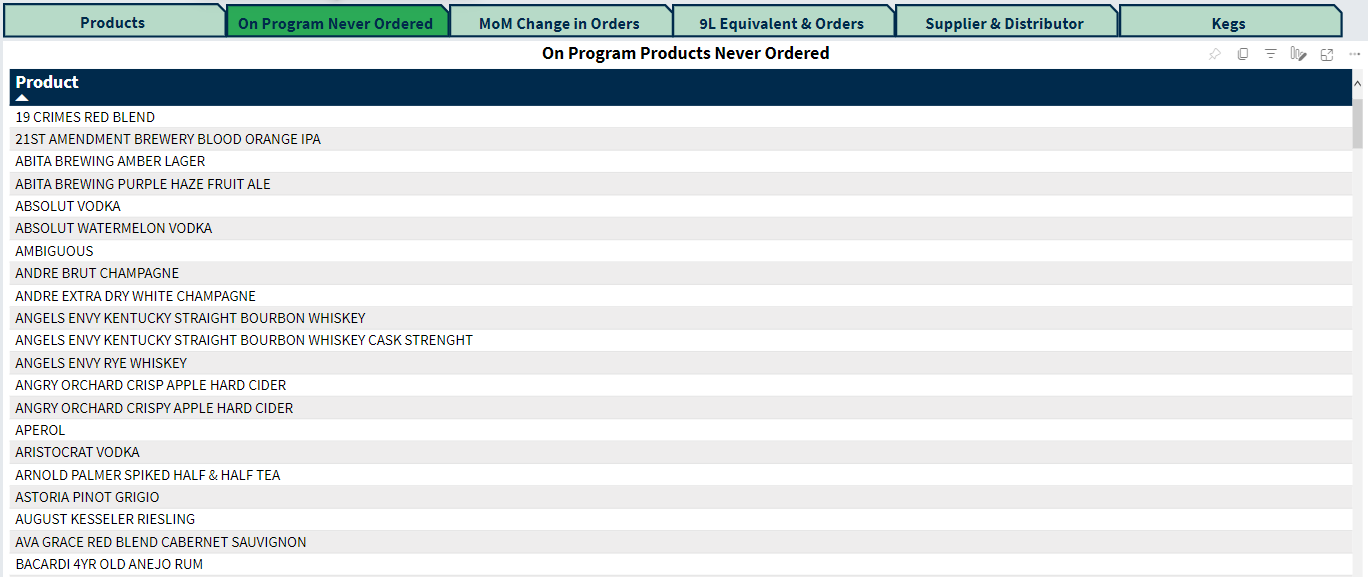
The On Program Never Ordered tab will display On Program products which were never purchased during the entire reporting period.
Note: This list will not change using the Invoice Date Range selection.
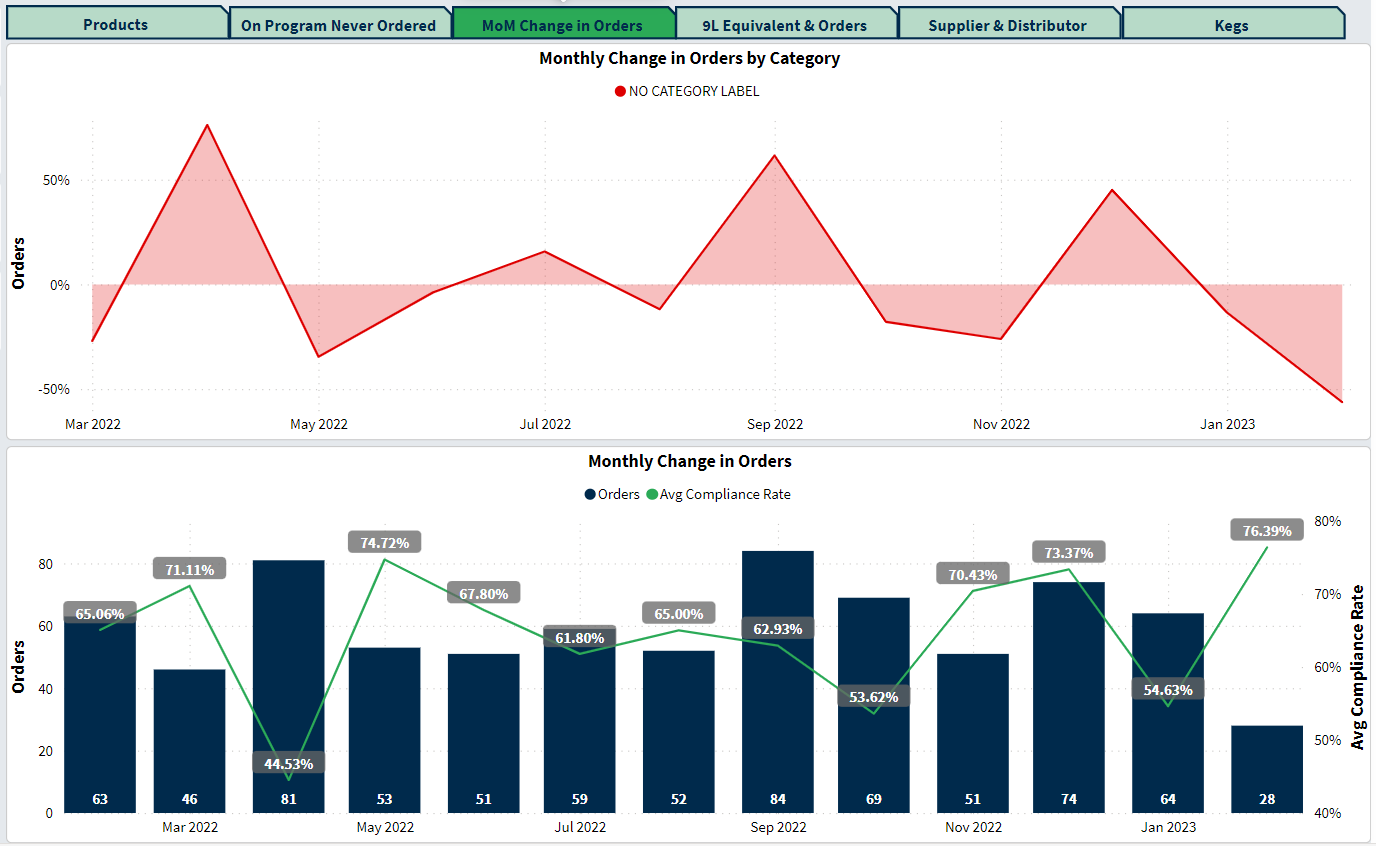
The MoM Change in Orders tab will have 2 visuals. At the top is the Monthly Change in Orders by Category (if you are using Categories for your products). At the bottom is the Monthly Change in Orders. The blue bars represent the number of orders, while the green line represents your Average Compliance Rate. Selecting one of the bars will change your filters to that specific month and selecting it again will change your filters back to their previous state.
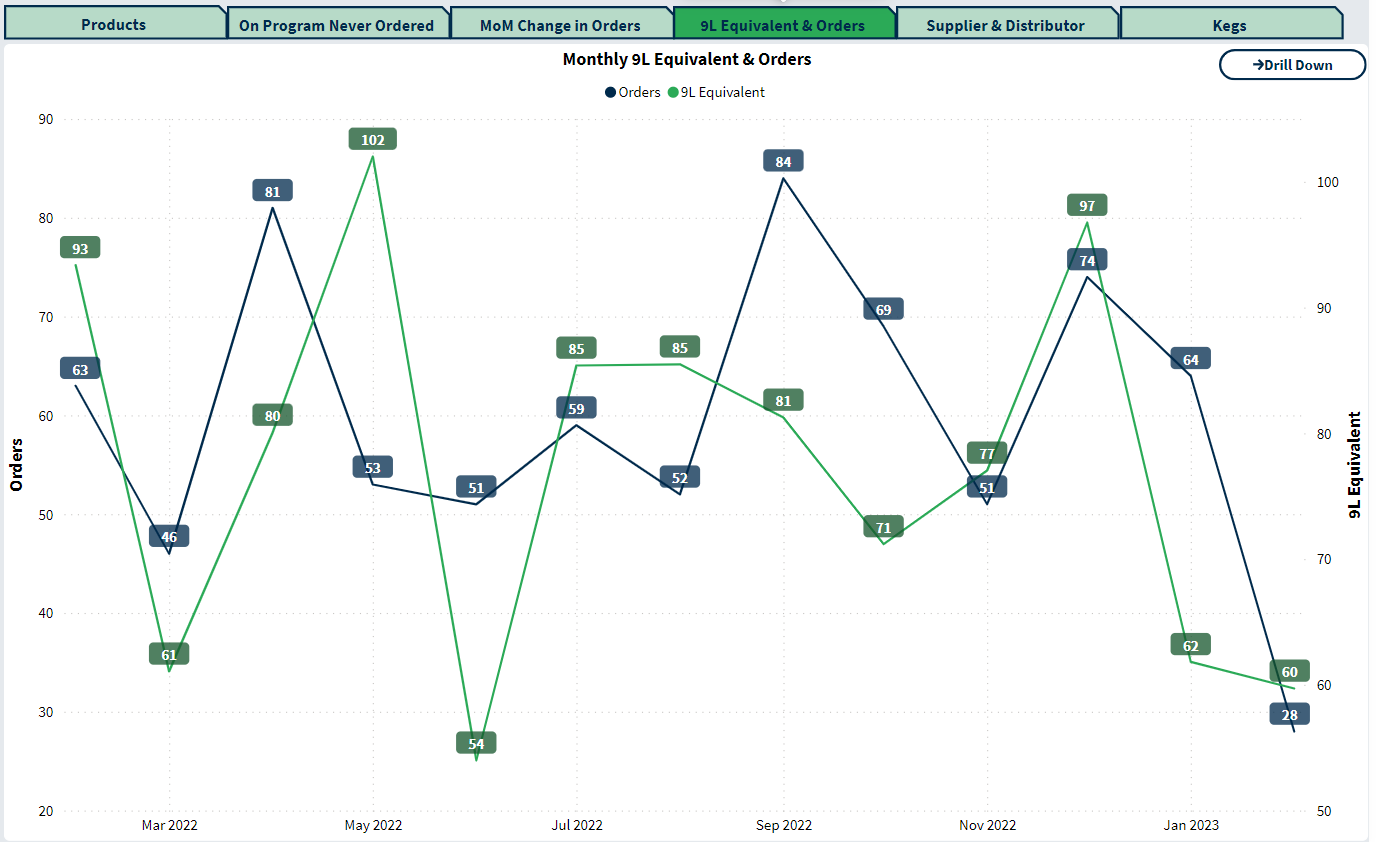
The 9L Equivalent & Orders tab will show the number of orders placed each month (represented in blue) as well as their 9L Equivalent (represented in green). Changing the Invoice Date Range filter will also change the months which are displayed. You can drill down further into the data by clicking the Drill Down button at the top-right corner of the visual. This will display Daily 9L Equivalent & Orders, rather than the monthly values.
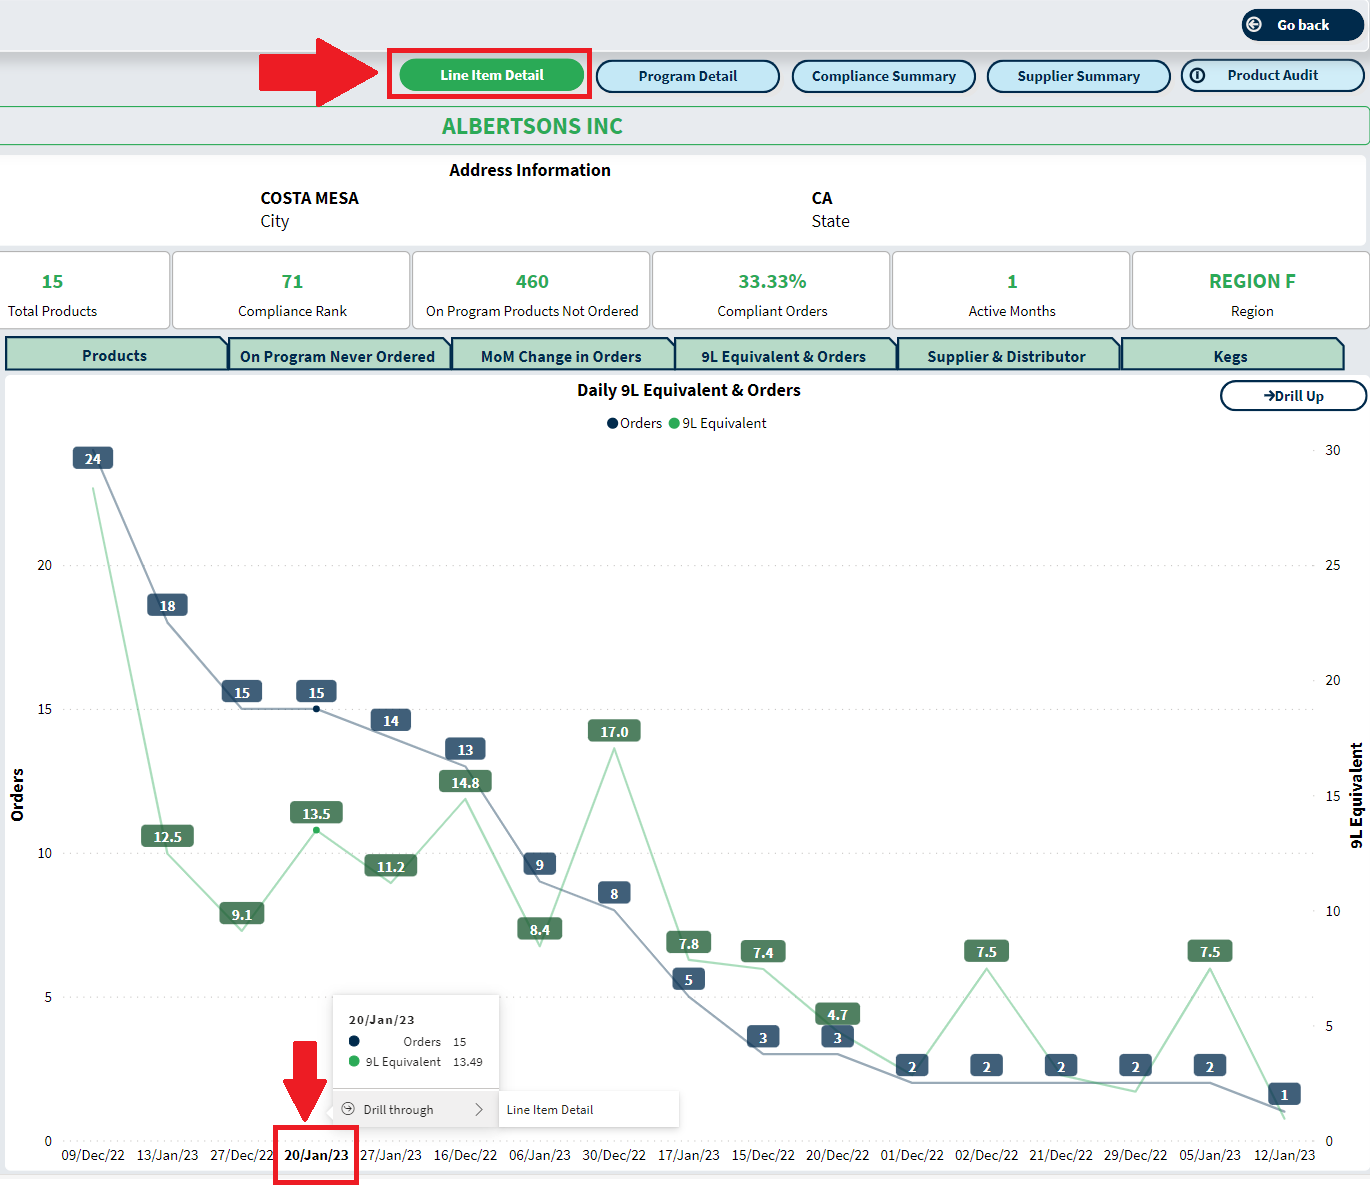
The Daily 9L Equivalent & Orders (displayed after clicking the Drill Down button from the 9L Equivalent & Orders tab) will display your the number of orders made on a specific date, and the 9L Equivalent.
Note: The visual is arranged from most orders on the left, to least orders on the right, so the dates at the bottom will not be in order.
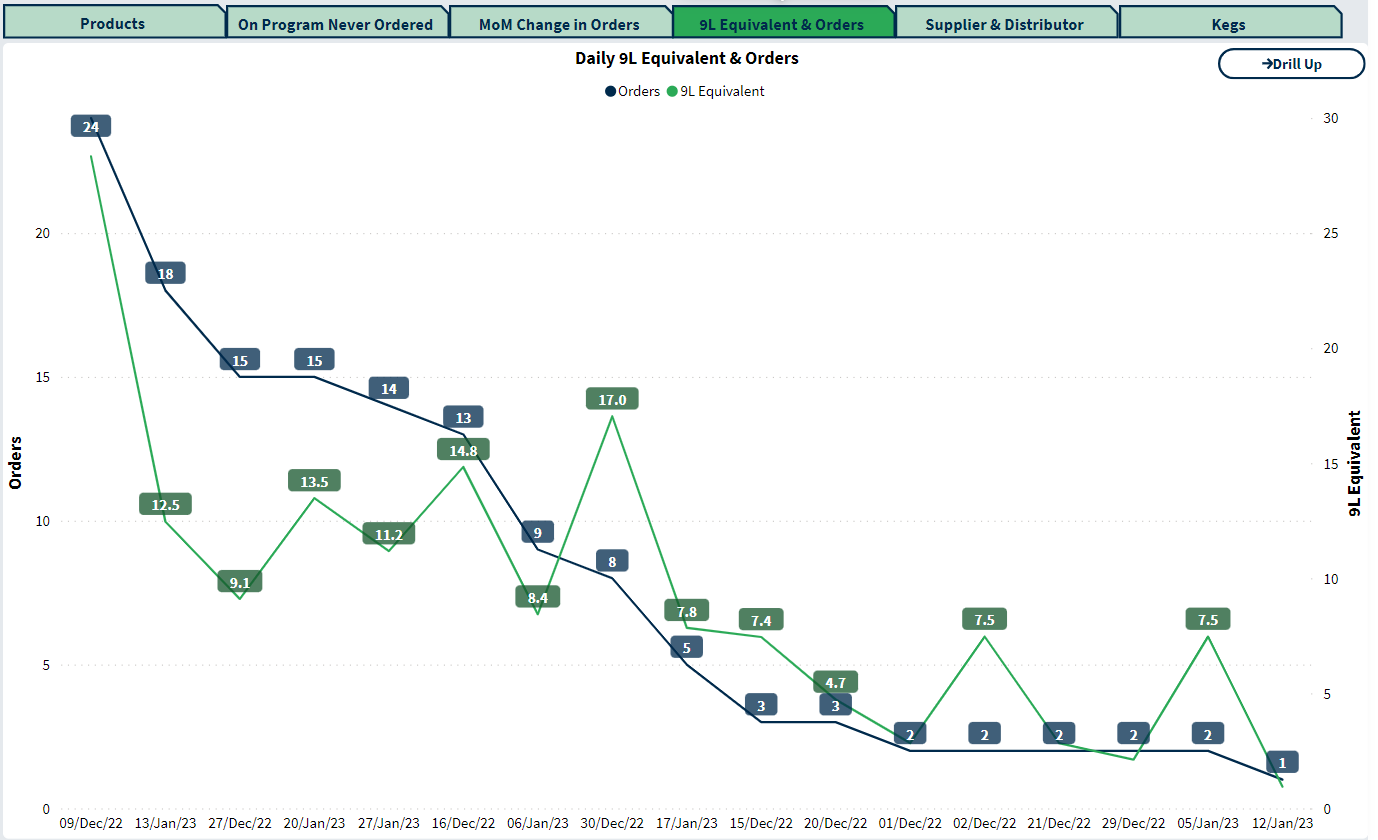
You can also click on a specific date at the bottom of this visual and the green Line Item Detail button at the top of the page will be active (this page is explained further here) allowing you to view the specific orders for this location on this date.
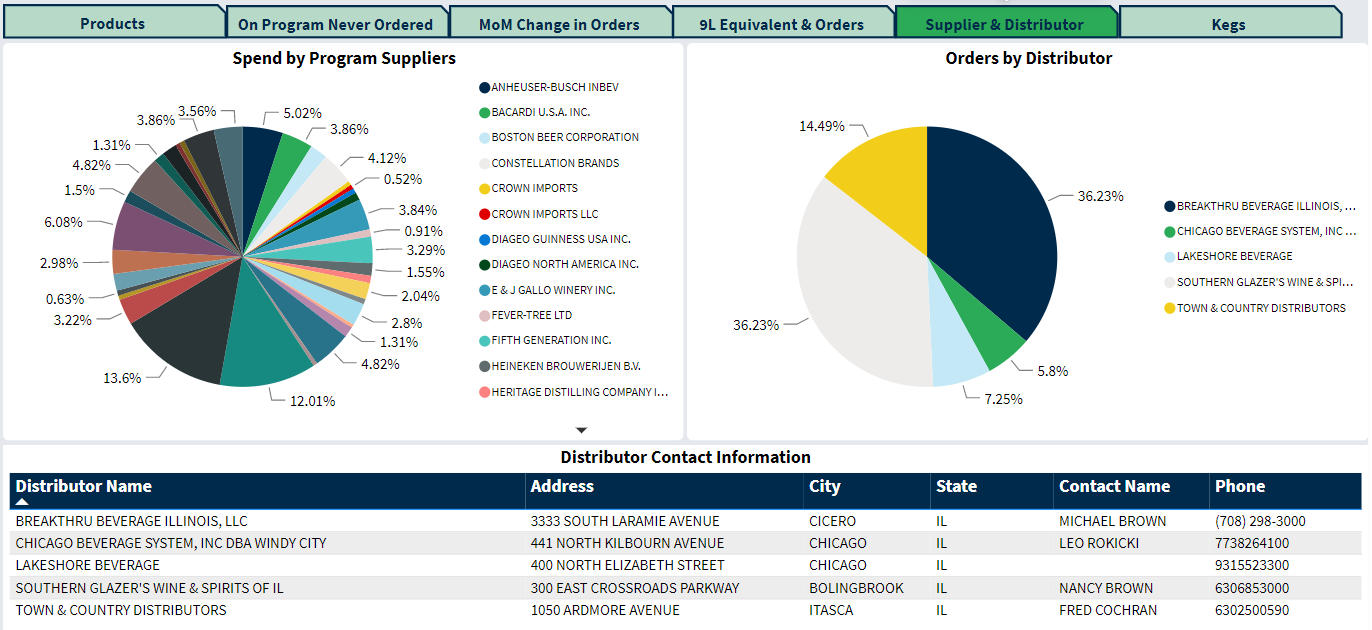
The Supplier & Distributor tab will show 2 visuals. On the left, the Spend by Program Suppliers shows the percentage of your total spend for each of the suppliers on your program. On the right, the Orders by Distributor shows your orders placed from each of your distributors as a percentage. You can click any slice of the pie chart to view your distributors' contact information in the chart below.
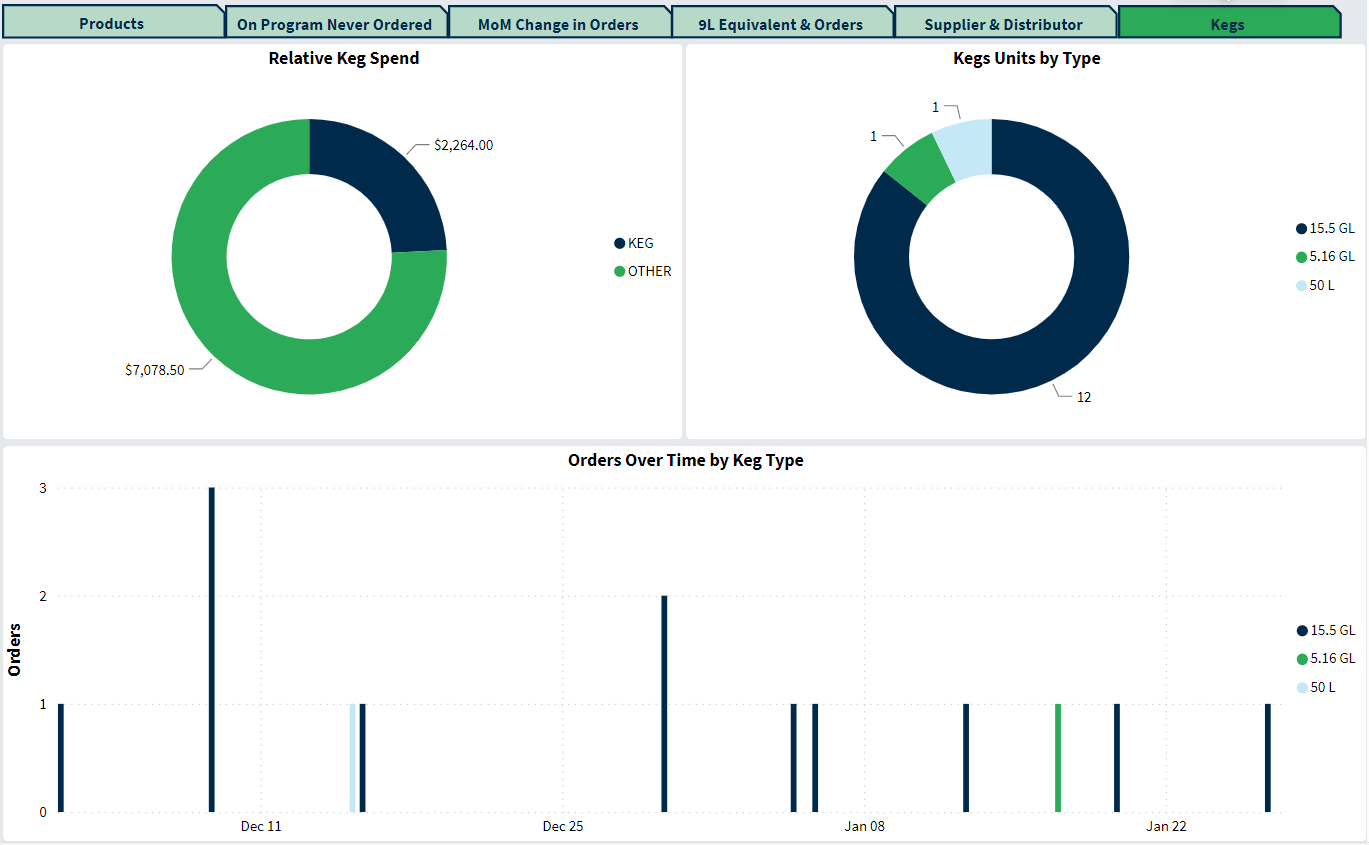
The Kegs tab displays a number of visuals specifically detailing your keg orders. You can click a slice of the circle graph to change your filters and clicking it again will de-select that slice.