Jump to:
To get to Supplier Summary Dashboard, click on Supplier Summary on the left-hand side of your Power BI screen.
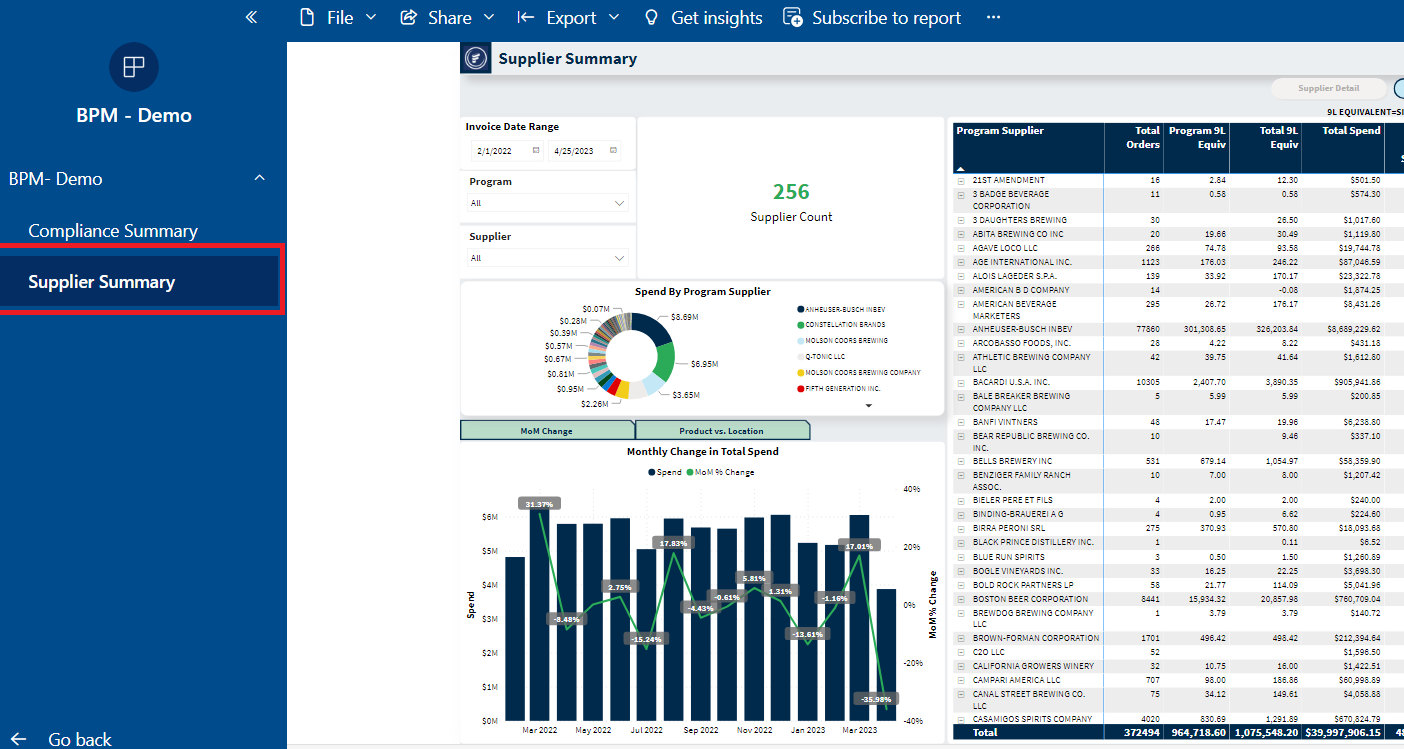
On the Supplier Summary, you will see different visuals, see below for an explanation of all visuals.
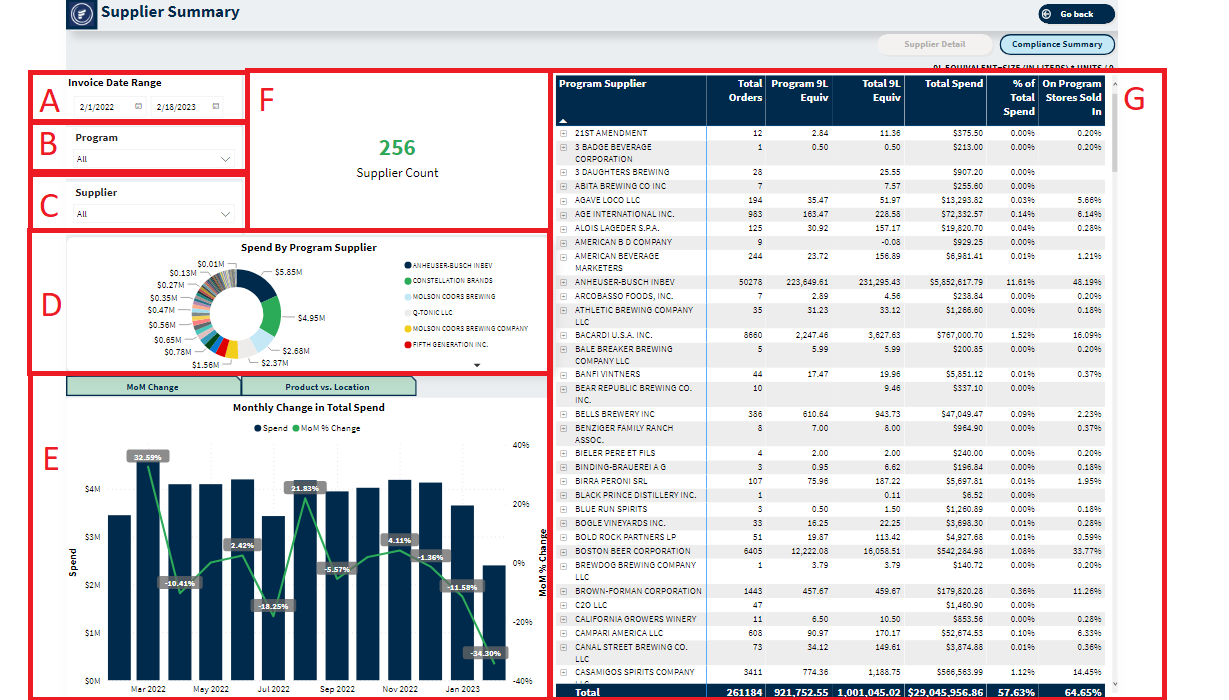
A. Invoice Date Range: The date range shown is the invoice date range that the data is populated from. You can change the date range to see data from a particular time.
B. Program: You can view data from all programs, or you can choose a specific program to view data from.
C. Supplier: You can view data from all suppliers, or you can choose a specific supplier to view data from.
D. Spend by Program Supplier: This chart breaks down the spend by every supplier. The top spend suppliers will show first on the chart going clockwise.
E. Monthly Change in Total Spend: This chart shows the monthly spend, and the percentage of change month to month.
F. Supplier Count: This shows the total count of suppliers the data is representing.
G. Program Supplier Information: This section gives information about each supplier, and has the ability to drill into each brand that was purchased by the supplier. Program Supplier Information shows the below information for each supplier and brand:

Program Supplier Information
Next to each supplier, you will see a plus sign (circled in red below) that allows you to see the brands under each supplier. In this testing example we do not have brands labeled, which is why it says "NO BRAND LABEL", but if you have labeled your products with brands, you will see them under their supplier.
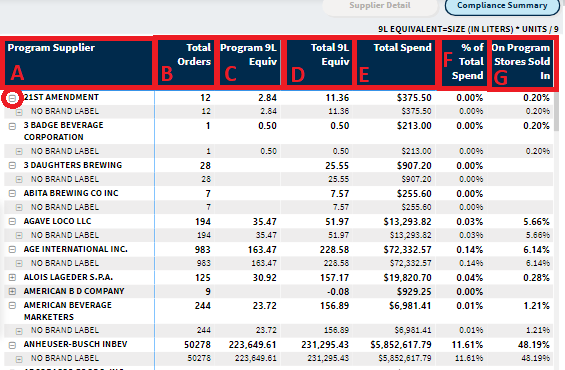
This visual shows different data metrics for each program supplier and brand.
A. Program Supplier: Supplier name, each row represents data from a different supplier. When you click on the circled plus sign to the left of each supplier name, you can expand to see data from the brands under each supplier.
B. Total Orders: Order count for each supplier.
C. Program 9L Equiv: On program 9L equivalent.
D. Total 9L Equiv: Both off and on program 9L equivalent.
E. Total Spend: Total spend for each supplier, on and off program.
F. % of Total Spend: The percentage of total spend each supplier accounts for, both on and off program.
G. On Program Stores Sold In: The percentage of on program products that are sold in stores from each supplier.
Supplier Drill Down
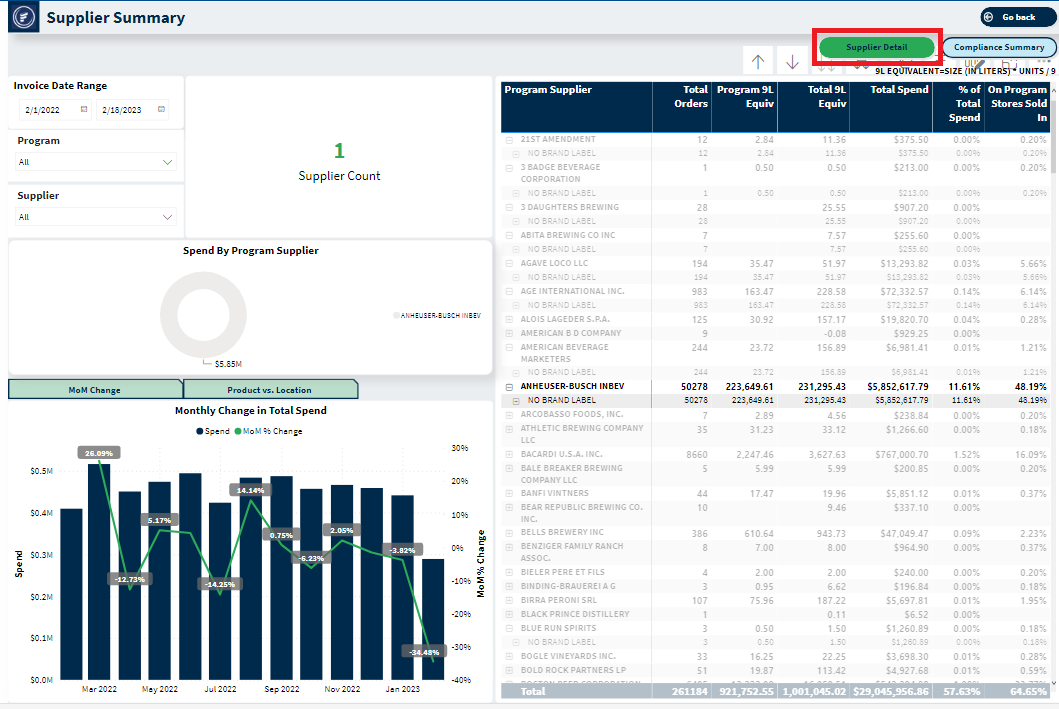
If you want information on a specific supplier, click on the supplier in the Program Supplier visual. In the below example, Anheuser-Busch InBev is clicked on, which drills into Anheuser-Busch InBev supplier data. All visuals will change to represent data from the supplier clicked on.
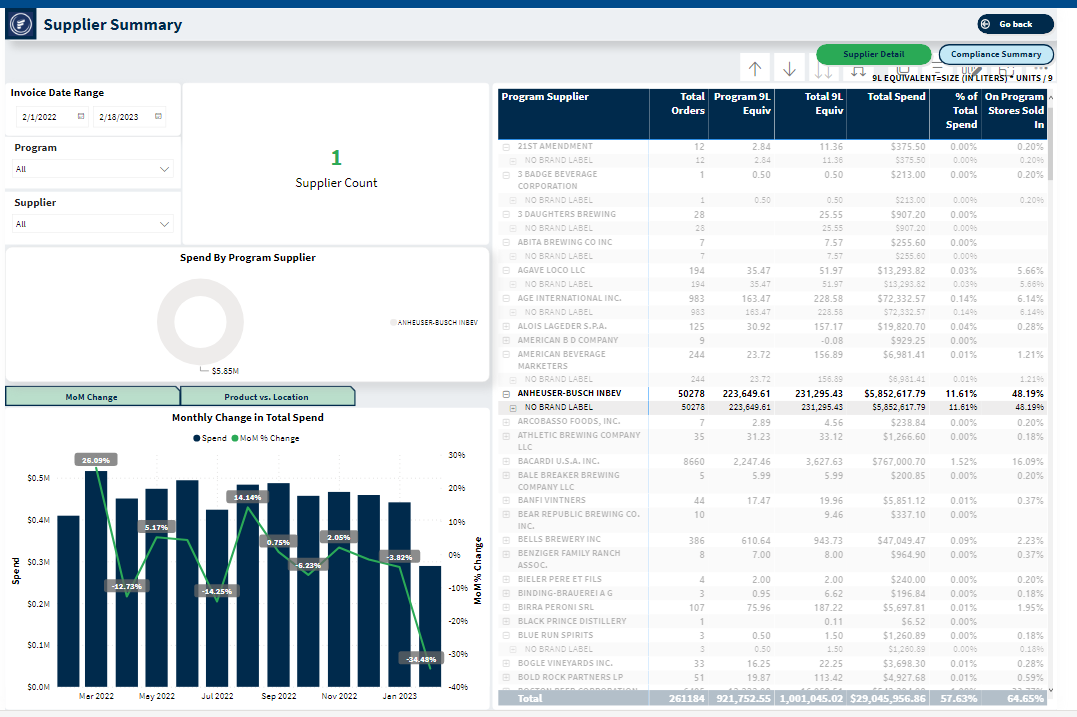
To get additional information on each supplier, click on the Supplier Detail button.