
The Inventory on Hand report gives visibility into inventory available at retailer locations for a selected date, both in dollars and units. The report is split into two sub-reports: Inventory Summary and Low Stock Assignments.
💡 Inventory on Hand is calculated using posted sales and deliveries at the end of each day. Data that was not received and posted by the previous day is not reflected in the report.
Use Inventory on Hand to:
- Review total inventory available across selected retailers/locations, or products.
- Track inventory value and units on hand.
- Compare current inventory to recent sales activity.
- Monitor sell-through trends.
- Identify locations or products that may need replenishment.
- Review low stock risk based on criteria you choose.
Filters for Inventory Summary and Low Stock Assignments
⚠️ Filters must be selected for the report to populate data.

The reports update based on your filter selections. Use filters to focus on:
- State - Inventory by state(s).
- Retailer/Location - Inventory by retailer(s)/location(s).
- Product - Inventory by product(s).
- Inventory as of Date - Inventory available on a specific date.
Inventory Summary
The Inventory Summary tab provides a high-level inventory details on a selected date, including inventory value across all locations, inventory units, sales activity, and inventory distribution among states or locations.
Widget Information
Learn more about the data available on the page.
|
Widget |
What it does |
Use case |
|---|---|---|
| Total Inventory | Total inventory value ($) and total units across locations based on the selected filters. | Understand your overall inventory level for a specific date, retailer, or product. |
| Inventory Per Location | The average inventory value and units available per location. | Monitor inventory distribution and values over time. |
| Average Daily Sales (Cost) - Last 90 Days | Calculates the average sales based on units that have been scanned at the register. | Use as a benchmark to compare against current inventory and estimate how quickly products are selling. |
| Inventory Turnover Last - 90 Days | Measures how often inventory is sold and replenished over the last 90 days. | Evaluate how efficiently inventory is moving and identify slow-moving or overstocked products. |
| Days of Inventory Remaining |
Estimates how many days current inventory will last based on recent sales. |
Identify whether inventory levels are sufficient or if delivery is needed. |
| Inventory ($) Trending - Last 90 Days | Line chart showing whether inventory value is increasing or decreasing across locations over the last 90 days. |
|
| Sell-Through Rate |
|
|
| Inventory ($) By Retailer |
|
Identify which retailers or locations hold the most inventory. |
| Inventory ($) By Product |
|
Determine which products make up the largest share of inventory. |
| Inventory by Location (State and Location) |
|
Visualize geographic distribution and pinpoint high- or low-inventory locations. |
Low Stock Assignments
Low Stock Assignments identifies where inventory may be running low by location and/or product.
Criteria to Populate Low Stock Details
After applying the filters at the top of the page, use the Flag By toggle to choose how low stock is evaluated:

- Location - Flags locations with low stock.
- Product - Location - Flags specific products at each location that are low in stock.
Use the Low Stock Criteria fields to define what should be considered low stock:
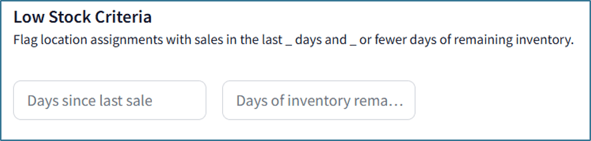
- Days since last sale - Locations or products that have not had a sale in the last X days.
- Days of inventory remaining - Locations or products that are expected to run out of inventory less than or equal to X number of days.
💡 There is no recommended value for these fields as the values will depend on product categories. For example, bakery items may have low inventory more frequently due to short shelf life, while products like propane or ice may last longer but sell quickly during peak seasons.
Widget Details
Learn more about the data available on the page.
| Widget | What it does | Use case |
|---|---|---|
| Location Assignments With Low Stock |
The percentage and total number of locations or products flagged as low stock vs. not flagged. |
Assess the overall level of inventory risk across your selected data. |
| Top Retailers by Low Stock Location % | The retailers or products that have the highest percentage of inventory flagged for low stock. | Identify where low stock issues are most concentrated - certain retailers and locations or products. |
| Low Stock Assignment Details |
|
Drill into specific location or product-location combinations that may need replenishment. |